Ten Essential PRAXIS Tricks That You Can't Possibly Live Without Knowing
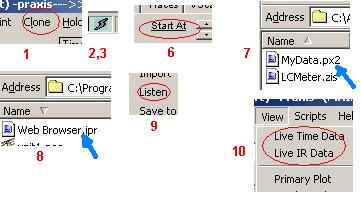
1). To get a new Plot to use, click the CLONE menu of an existing Plot. Or use the "View, *new plot form*" menu of the Main Form.
2). To automatically scale the displayed data in a Plot vertically, Left-Click on the small grey "Lightning Bolt" button at the bottom of the plot. This "AutoScale" button will briefly flash yellow while the scaling is performed.
3). If two traces shown in a PLOT contain data of the same type with the same units of measure, Right-Click on the "Lightning Bolt" AutoScale button to set them to the same settings.
4). To quickly copy the data traces from one Plot to another, click your mouse in the trace area of the "from" Plot, hold down the left mouse button, drag the mouse cursor to the "to" Plot and release the mouse button. In other words, just "Drag'N'Drop". You can also Drag'N'Drop Plots to the PostProcess Source and Target selectors.
5). To quickly format the data in one plot using the format of similar data in a another plot, do the "Drag'N'Drop" operation between the "Status Bar" areas at the bottoms of the plots. The Status Bar is the area where the title and AutoScale button is shown. And to quickly resize a plot to the same size as another plot on your screen, drag from the body of the plot having the desired size to the Title Bar at the top of the plot that you want to resize -- only the plot's size will be transferred.
6). If a label in PRAXIS is shown underlined, then you can double-click it to set to a default setting. The default may be "0" for settings that are not normally needed, or to the maximum extremes for range settings (such as frequency Start or Stop).
7). From the Windows Explorer or the file browser shown from the "My Computer" icon, you can double-click on file types used by PRAXIS (*.px2, *.pxd, *.fr2, etc.) to start PRAXIS running with that file loaded. Or, if PRAXIS is already running the data file will open in a new Plot form.
8). If you double-click on a script filename (of type "*.ipr") in its script folder before PRAXIS is open, PRAXIS will start up running the selected script.
9). If a PRAXIS plot contains standard time domain data, use the "File, Listen" menu and your soundcard to audition the signal in that file.
10). If you want to see the raw time domain data while you are making a frequency domain measurement, check the "View, Live Time Data" menu of the Main Form. A special "Live Time" Plot will appear when the acquisition starts. If your measurement internally uses an Impulse Response, you can monitor that with the "View, Live IR Data" menu and the resulting "Live IR" plot.
...And remember that you can use your Mouse Wheel on numerical controls!